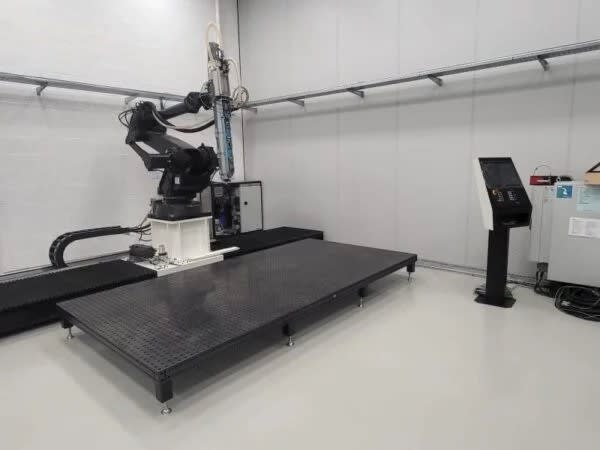
The Flexbot machine generates a vast array of data during operation. From every motor, sensor, actuator, to control signal – it’s all valuable data. This data, when stored and utilized, can be extremely beneficial. The data logging platform monitors and logs every signal from the entire machine, ranging from the robot to the extruder, and keeps track of each actuator and sensor.
Accessible parameters for end users
With the Flexbot, we log several hundred parameters, though not all are equally intriguing. Here’s a brief overview of some of the accessible parameters for end users:
Extruder
- Speed setpoint
- Speed
- Torque
- Pressure in zones 1 and 2
- Temperatures in heatzones 1-4
- Meltpump temperature
- Setpoints for all heatzones
- Sensor inputs from the transport system
- Watercooling flow
Robot, track and transport
- X, Y, Z coordinates
- A, B, C angles of the end effector
- Feedrates
- Velocity
- Accelerations
- Jerk
- Lubrication system status
- Transport pump status
- Valve opening times
- Track position
- Programmed machine coordinate systems
- Work coordinate system
Spindle and toolchanger
- RPM setpoint
- RPM
- Toolchanger status
- Tools loaded
- Spindle connectivity
- Spindle tool status
Alarms
Logging of all raised machine alarms and errors
Practical applications
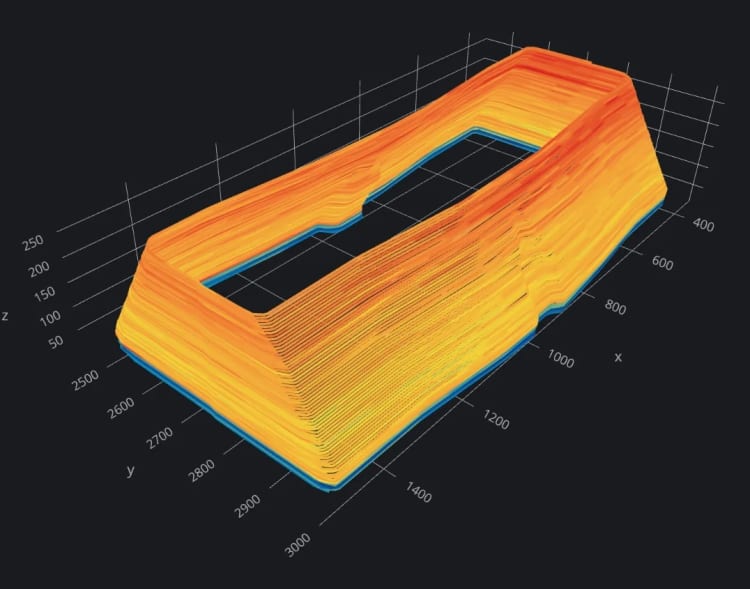
The possibilities are limited only by your imagination. For instance, we can map the X, Y, Z coordinates of the machine and color-code them based on certain values:
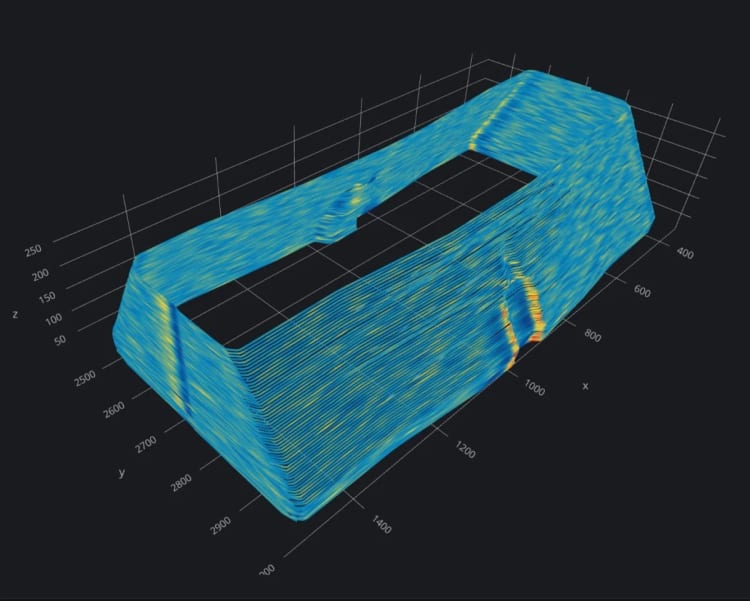
X, Y, Z vs. pressure extruder
This visualization displays the logged coordinates and the pressure at the extruder sensor input in color. Higher pressures at corners compared to straight walls are evident, which is logical as the machine decelerates slightly at corners. However, ideally, the pressure should remain constant throughout the print. The data also helps identify layer transitions, with noticeable pressure spikes and drops, offering insights to enhance the printing process.
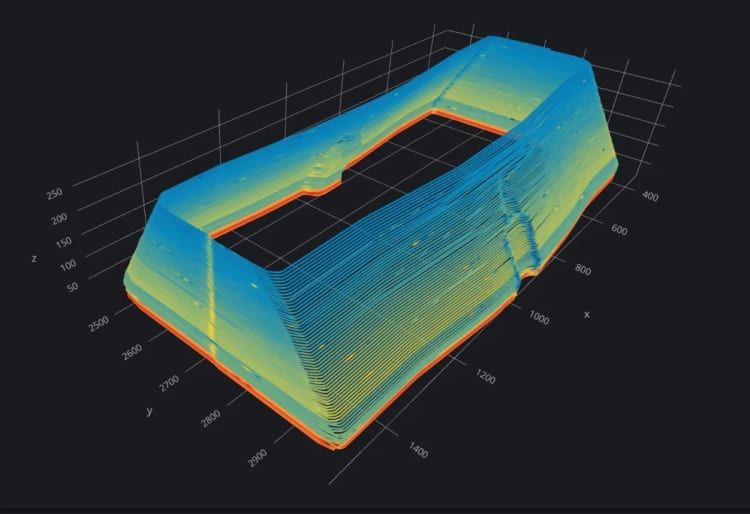
X, Y, Z vs. extruder speed screw
The below image correlates the machine coordinates with the speed of the extruder screw. In this case, where an extruder with dynamic flow control is used, the screw is pressure-controlled rather than speed-controlled. The image reveals changes in speed depending on layer length and initial higher speeds in the first layers due to the printing strategy. Identifying irregular speed fluctuations can help detect and resolve issues, thereby improving machine performance and print quality.
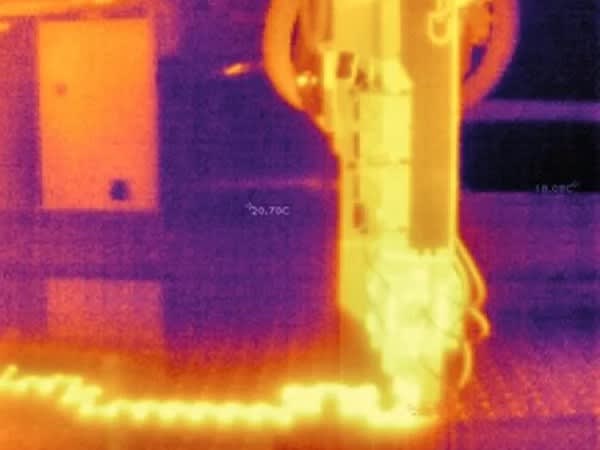
X, Y, Z vs. power of Heatzone 1
Another plot compares the power to Heatzone 1 with the X, Y, Z coordinates. It shows lower power requirements for initial layers, possibly because the extruder was pre-heated. This raises questions about process optimization, like whether pre-purging before printing could stabilize the process. Additionally, increasing heat requirements for shorter layers are observed, prompting further investigation.
Conclusion
These examples are just the tip of the iceberg in demonstrating how the data logging platform can provide deep insights into the printing process. Beyond just printing, it opens avenues for developing algorithms for machine condition monitoring and preventive maintenance. The combination of extensive logging parameters and potential future sensors offers a comprehensive view of the large format 3D printing process. With our API, you can either develop in-house software tools or utilize those offered by CEAD. Moreover, with rapid advancements in AI technology, having access to this data is a forward-thinking strategy. Hence, it’s never too early to start collecting data from your printing process; it could be invaluable in the future.